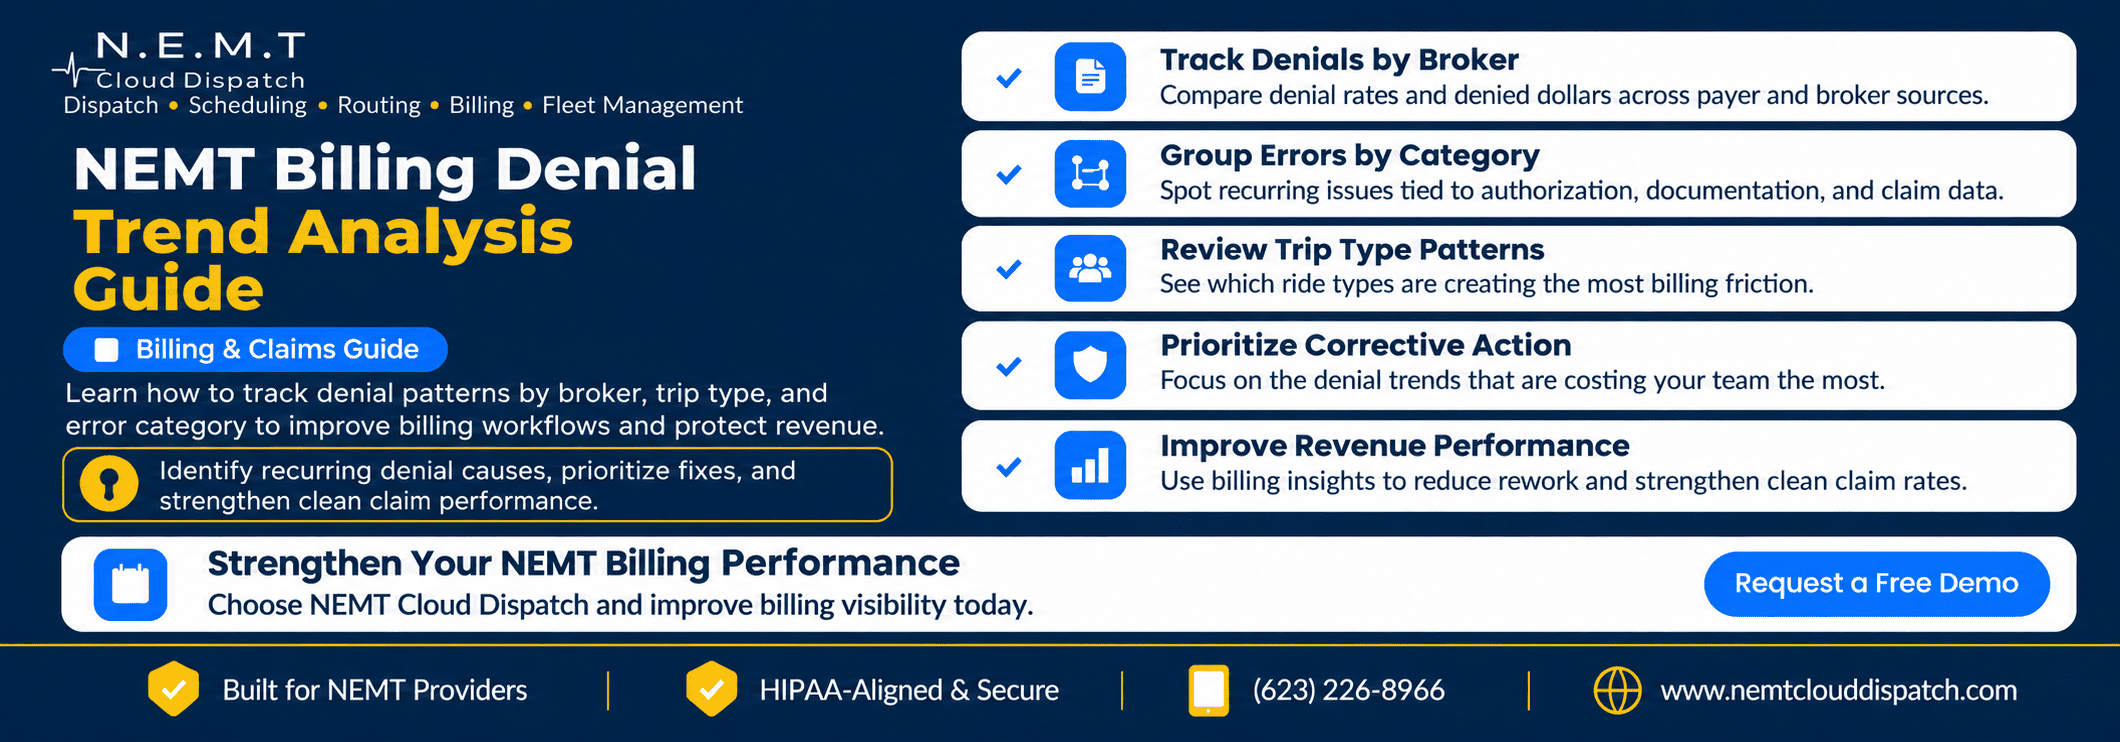
NEMT billing denial trend analysis helps providers move beyond correcting claims one at a time. Instead, billing teams can examine weeks or months of claim outcomes to determine where losses are concentrated: a specific broker, a certain trip type, a recurring error category, or a combination of all three.
Ten denials do not always represent the same problem. One broker may have a low denial rate but a high dollar impact, while another may generate frequent low-value rejections that are corrected quickly.
A structured NEMT claims denial reporting process turns those differences into useful management decisions.
Why Denial Trends Matter More Than Individual Denials
Individual claim review is still necessary, but trend analysis answers a broader question: where should the billing team focus first?
For an overview of common denial reasons, see Why NEMT Claims Get Denied.
This article focuses on grouping actual denial data and monitoring patterns over time. A useful NEMT billing denial trend analysis should show both frequency and financial impact so claim volume alone does not distort the conclusion.
For example, a broker with 50 denied claims is not automatically performing worse than a broker with 20. The comparison becomes meaningful only when teams consider total claim volume, denied dollars, recovery rates, and the types of trips involved.
Step 1: Choose a Consistent Analysis Window
Start with a fixed period such as 30, 60, or 90 days. Use the same period when comparing brokers, trip types, and denial categories.
For every rejected, denied, or delayed claim, capture:
- Broker or payer
- Claim and trip reference
- Date of service
- Submission date
- Rejected or denied status
- Trip type
- Claim amount
- Reason code or error category
- Recovered amount
- Unrecovered amount
- Resolution date
A consistent data set makes NEMT claims denial reporting easier to compare from one period to another.
It also creates a reliable foundation for NEMT billing denial trend analysis because every broker and service category is being evaluated with the same definitions and time frame.
Avoid combining unrelated periods or different definitions of “denied.” If one report includes only adjudicated denials while another includes front-end rejections, the percentages will not represent the same performance issue.
Step 2: Separate Rejections From Adjudicated Denials
Rejections and denials can point to different problems in the billing workflow.
CMS explains that electronic claims may fail front-end edits before normal adjudication, while other claims move further through processing and may later be denied. See the CMS electronic health care claims guidance for additional context.
Track these separately:
- Rejection rate
- Denial rate
- Rejected dollars
- Denied dollars
- Average resolution time for each status
This separation keeps NEMT billing denial trend analysis focused on where the problem occurs in the revenue cycle rather than combining every unsuccessful submission into one number.
It also helps teams determine whether they are dealing primarily with data or transmission problems before adjudication or payment-related problems later in the claim process.
Step 3: Calculate Denial Rate and Denied Dollars by Broker
Raw denial counts are not enough.
If Broker A represents 45% of your claims, it may naturally generate more denials than a broker responsible for only 10% of claim volume.
Compare both rates and dollars.
Broker denial rate = denied adjudicated claims ÷ total adjudicated claims for that broker × 100
Also track:
- Total denied claims
- Total denied dollars
- Recovered dollars
- Net unrecovered dollars
- Average denied amount
- Average resolution time
NEMT Cloud Dispatch’s Broker Management Software helps organize broker-specific trip activity so teams can connect billing outcomes with the originating broker.
Broker-level NEMT billing denial trend analysis can then reveal whether a relationship has a high-frequency denial problem, a high-dollar problem, or both.
A strong NEMT claims denial reporting view should make these differences visible without relying on raw claim counts alone.
Step 4: Compare Denials by Trip Type
The next analytical layer is trip type.
Segment claims according to categories relevant to your operation, such as:
- Ambulatory transportation
- Wheelchair transportation
- Recurring trips
- One-time trips
- Long-distance transportation
- Prior-authorization trips
- Specialty-service trips
Then compare the same billing measures across each category.
A broker might have an acceptable overall denial rate but a significantly higher rate for wheelchair transportation. Another broker may perform well on one-time trips but show repeated problems with recurring rides.
That is where NEMT billing denial trend analysis becomes more useful than a broker-level total. It shows which service pattern is actually driving the loss.
Step 5: Build a Broker × Trip Type Denial Matrix
A denial matrix provides one of the clearest ways to identify concentration.
| Broker | Ambulatory | Wheelchair | Recurring |
|---|---|---|---|
| Broker A | 2.1% | 8.4% | 3.0% |
| Broker B | 3.2% | 4.1% | 9.7% |
| Broker C | 1.8% | 2.5% | 2.9% |
These percentages are illustrative, but the method is practical.
Instead of concluding that “Broker B has a denial problem,” the billing team can see that Broker B’s issue is concentrated in recurring transportation.
Adding this matrix to NEMT billing denial trend analysis gives teams a defined starting point for further investigation: the broker, trip type, and analysis period.
This is more actionable than treating every claim from the broker as part of the same problem.
Step 6: Group Reason Codes Into Root-Cause Categories
Keep the payer’s original reason code, then map it to a consistent internal root-cause category.
Useful categories may include:
- Authorization or referral
- Eligibility or payer mismatch
- Missing documentation
- Coding or modifier issue
- Duplicate submission
- Timely filing
- Trip-data mismatch
- Billing-format or transmission issue
- Coverage or contract rule
The official X12 Claim Adjustment Reason Codes provide an authoritative reference for understanding why a claim or service line was paid differently than billed.
Grouping detailed codes into broader management categories makes NEMT billing denial trend analysis more consistent across brokers and time periods, even when different payers use different codes or terminology.
The objective is not simply to count codes. It is to identify which operational or billing process repeatedly produces the financial loss.
Step 7: Rank Problems by Financial Impact, Not Just Frequency
Frequency alone can send a billing team toward the wrong problem.
Suppose a 90-day review shows:
- Authorization errors: $24,500 denied
- Missing documentation: $11,200 denied
- Timely filing: $8,900 denied
- Coding errors: $3,100 denied
If authorization problems are also difficult to recover, they may deserve attention before a higher-frequency but lower-value category.
One practical prioritization method is to compare:
Frequency × denied dollars × recovery difficulty
In NEMT billing denial trend analysis, this financial prioritization helps teams focus on problems that create the largest revenue impact.
That is where NEMT claims denial reporting becomes a revenue-protection tool rather than simply a list of billing mistakes.
Step 8: Compare Trends Month Over Month
One month can be misleading.
A backlog, new broker launch, staffing change, large correction batch, or temporary documentation problem can distort a short reporting period.
Use rolling 30-, 60-, or 90-day comparisons.
Track:
- Denial rate
- Rejection rate
- Denied dollars
- Net unrecovered dollars
- Top reason categories
- Broker-specific denial rate
- Trip-type-specific denial rate
- Average resolution time
A reliable NEMT billing denial trend analysis compares multiple periods rather than treating one month’s performance as a permanent pattern.
If a denial category increases for three consecutive periods, it deserves investigation even if the total financial impact is still relatively small.
Step 9: Trace High-Impact Patterns Back to Trip Records
Once a meaningful pattern appears, trace affected claims back to the original transportation records.
Review:
- Broker source
- Authorization
- Date of service
- Trip type
- Mileage
- Documentation
- Required signatures
- Completion status
NEMT Cloud Dispatch connects operational and billing information throughout the trip lifecycle.
NEMT Billing and Claims Management supports billing validation and claim tracking, while the billing-ready trip record explains how completed trip information can remain connected as transportation moves toward billing.
This connection strengthens NEMT billing denial trend analysis because the billing team can investigate where a repeated problem began instead of reviewing the payer response in isolation.
It also allows NEMT claims denial reporting to move from “What was denied?” to “What recurring operational condition is associated with these denials?”
Step 10: Measure Results Before and After Corrective Actions
Once a pattern has been identified, establish a corrective action and record the implementation date.
Then compare performance before and after the change.
For example:
Before workflow change: Authorization denial rate = 7.4%
After workflow change: Authorization denial rate = 3.1%
The exact numbers will vary by operation, but the method is what matters.
A closed-loop NEMT billing denial trend analysis should document:
- The identified problem
- Broker or trip type affected
- Denied dollars
- Root cause
- Corrective action
- Implementation date
- Pre-change result
- Post-change result
This approach turns denial analytics into measurable process improvement rather than another static report.
Metrics That Matter for Denial Trend Analysis
The scorecard for NEMT billing denial trend analysis should remain focused on measures that explain recurring billing losses.
Track:
- Denial rate
- Rejection rate
- Denied dollars
- Recovery rate
- Net unrecovered dollars
- Average resolution time
- Top-three-cause concentration
- Denial rate by broker
- Denial rate by trip type
These metrics support NEMT claims denial reporting while keeping the analysis focused specifically on denial performance and revenue impact.
Frequently Asked Questions
How Can NEMT Providers Identify Recurring Billing Denials?
Use a fixed analysis window and group claims by broker, trip type, reason category, denied dollars, and resolution status. Compare rates and financial impact across multiple periods instead of relying on raw claim counts.
What Is the Difference Between a Rejected Claim and a Denied Claim?
A rejected claim often fails front-end or transaction edits before normal adjudication. A denied claim has generally moved further through the payer’s processing workflow and was not approved for payment. Terminology can vary by payer, so retain the original claim status and reason information.
How Should NEMT Billing Teams Categorize Claim Errors?
Keep the payer’s original reason code and map it to a consistent internal category such as authorization, eligibility, documentation, coding, timely filing, duplicate submission, trip-data mismatch, or transmission.
Can Providers Analyze Billing Problems by Broker or Trip Type?
Yes. NEMT billing denial trend analysis is especially useful when broker and trip-type results are evaluated together. A denial matrix can reveal that a problem is concentrated in one specific combination rather than across an entire broker relationship.
What Billing KPIs Should NEMT Business Owners Track?
For denial analysis, prioritize denial rate, rejection rate, denied dollars, recovery rate, net unrecovered dollars, resolution time, and denial concentration by broker, trip type, and root-cause category.
How Can Connected Dispatch and Billing Data Help Investigate Recurring Claim Problems?
Connected records allow teams to compare the billing outcome with the original authorization, broker, trip type, mileage, documentation, and completion information.
That makes NEMT claims denial reporting more useful because the team can investigate where the repeated issue began.
Uncover the Revenue Loss Hidden in the Pattern
One denied claim needs attention. A recurring pattern needs analysis.
Used consistently, NEMT billing denial trend analysis helps NEMT operators identify which broker, trip type, reason category, or combination is repeatedly creating revenue loss and whether those losses improve after workflow changes.
NEMT Cloud Dispatch connects broker, trip, documentation, dispatch, and billing information so teams can investigate recurring claim problems with the operational context behind them.
NEMT claims denial reporting can then focus management attention on the patterns with the greatest financial impact and show whether corrective actions are actually reducing those losses.
Explore NEMT Cloud Dispatch Billing and Claims Management or Request a Demo to see how connected trip and billing data can support stronger NEMT billing denial trend analysis and revenue-cycle decisions.